
Québec Carnival Dynamic Map
Microsite Project




Details
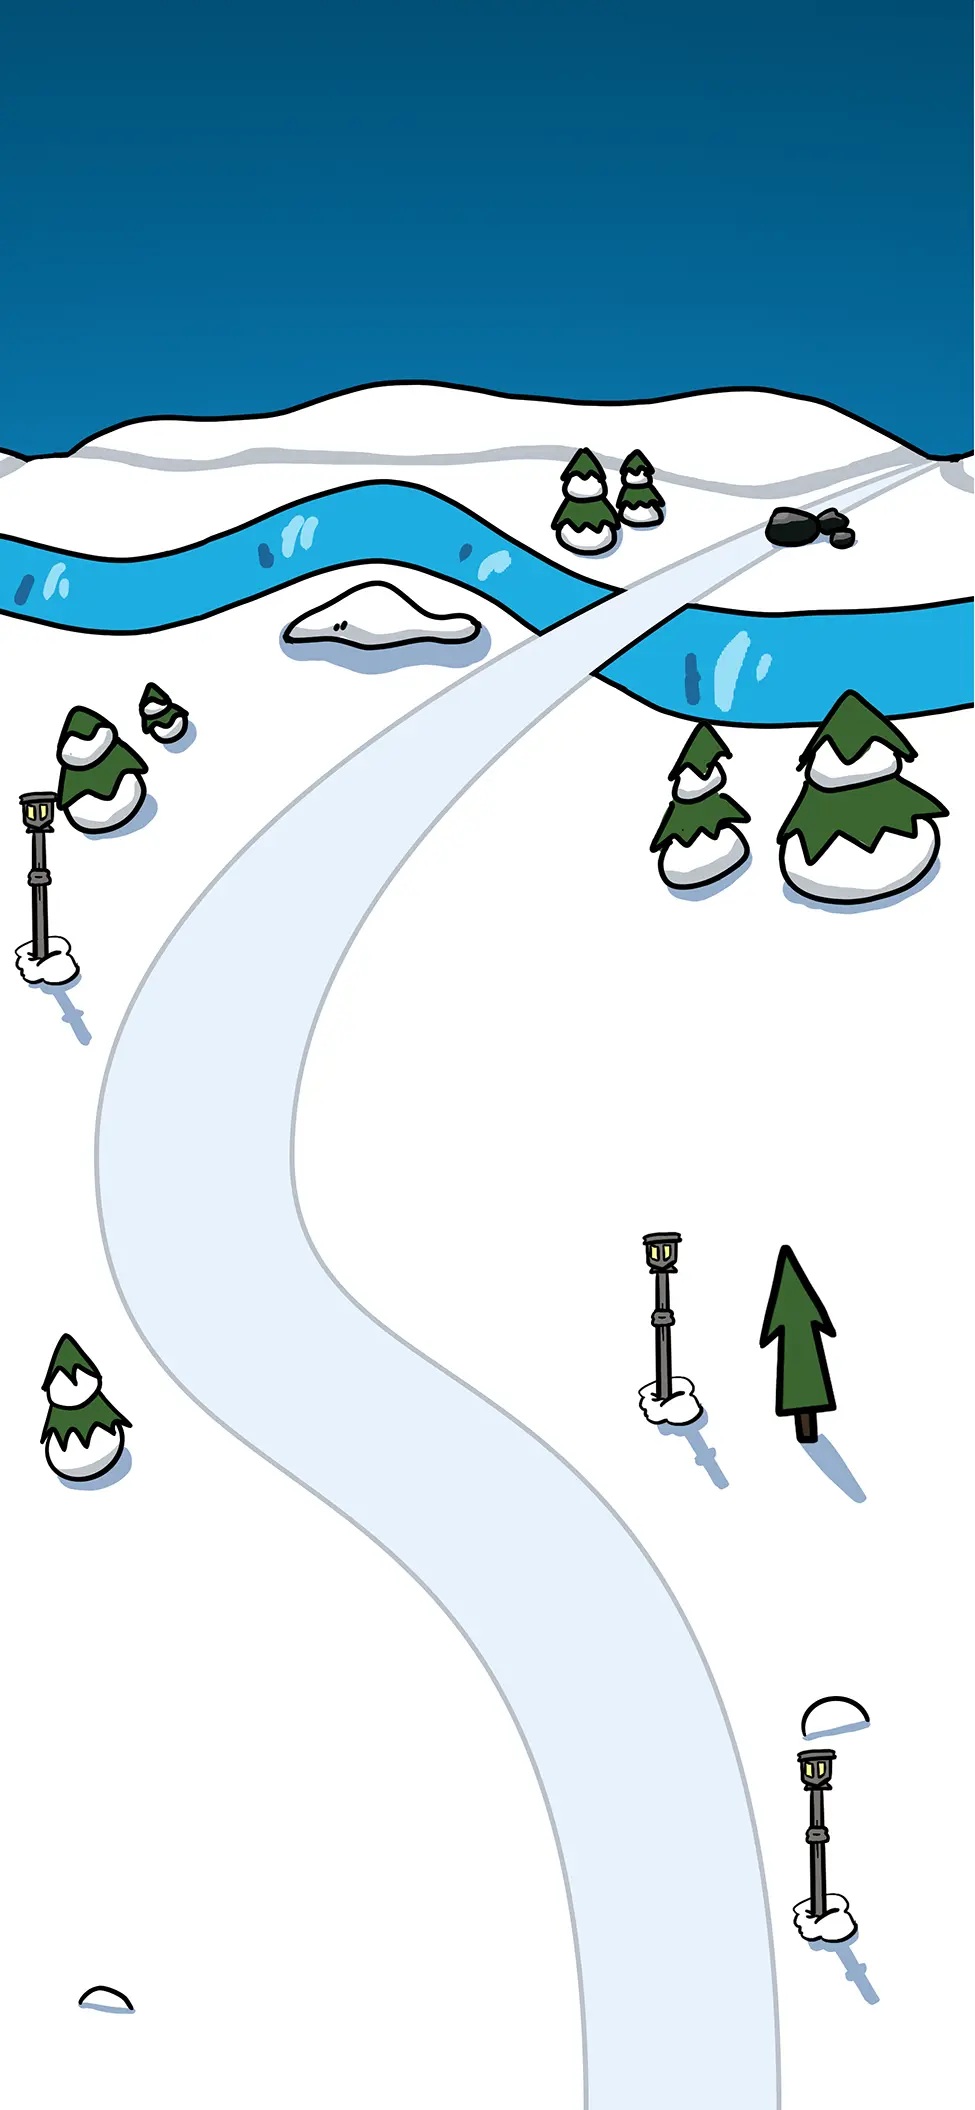
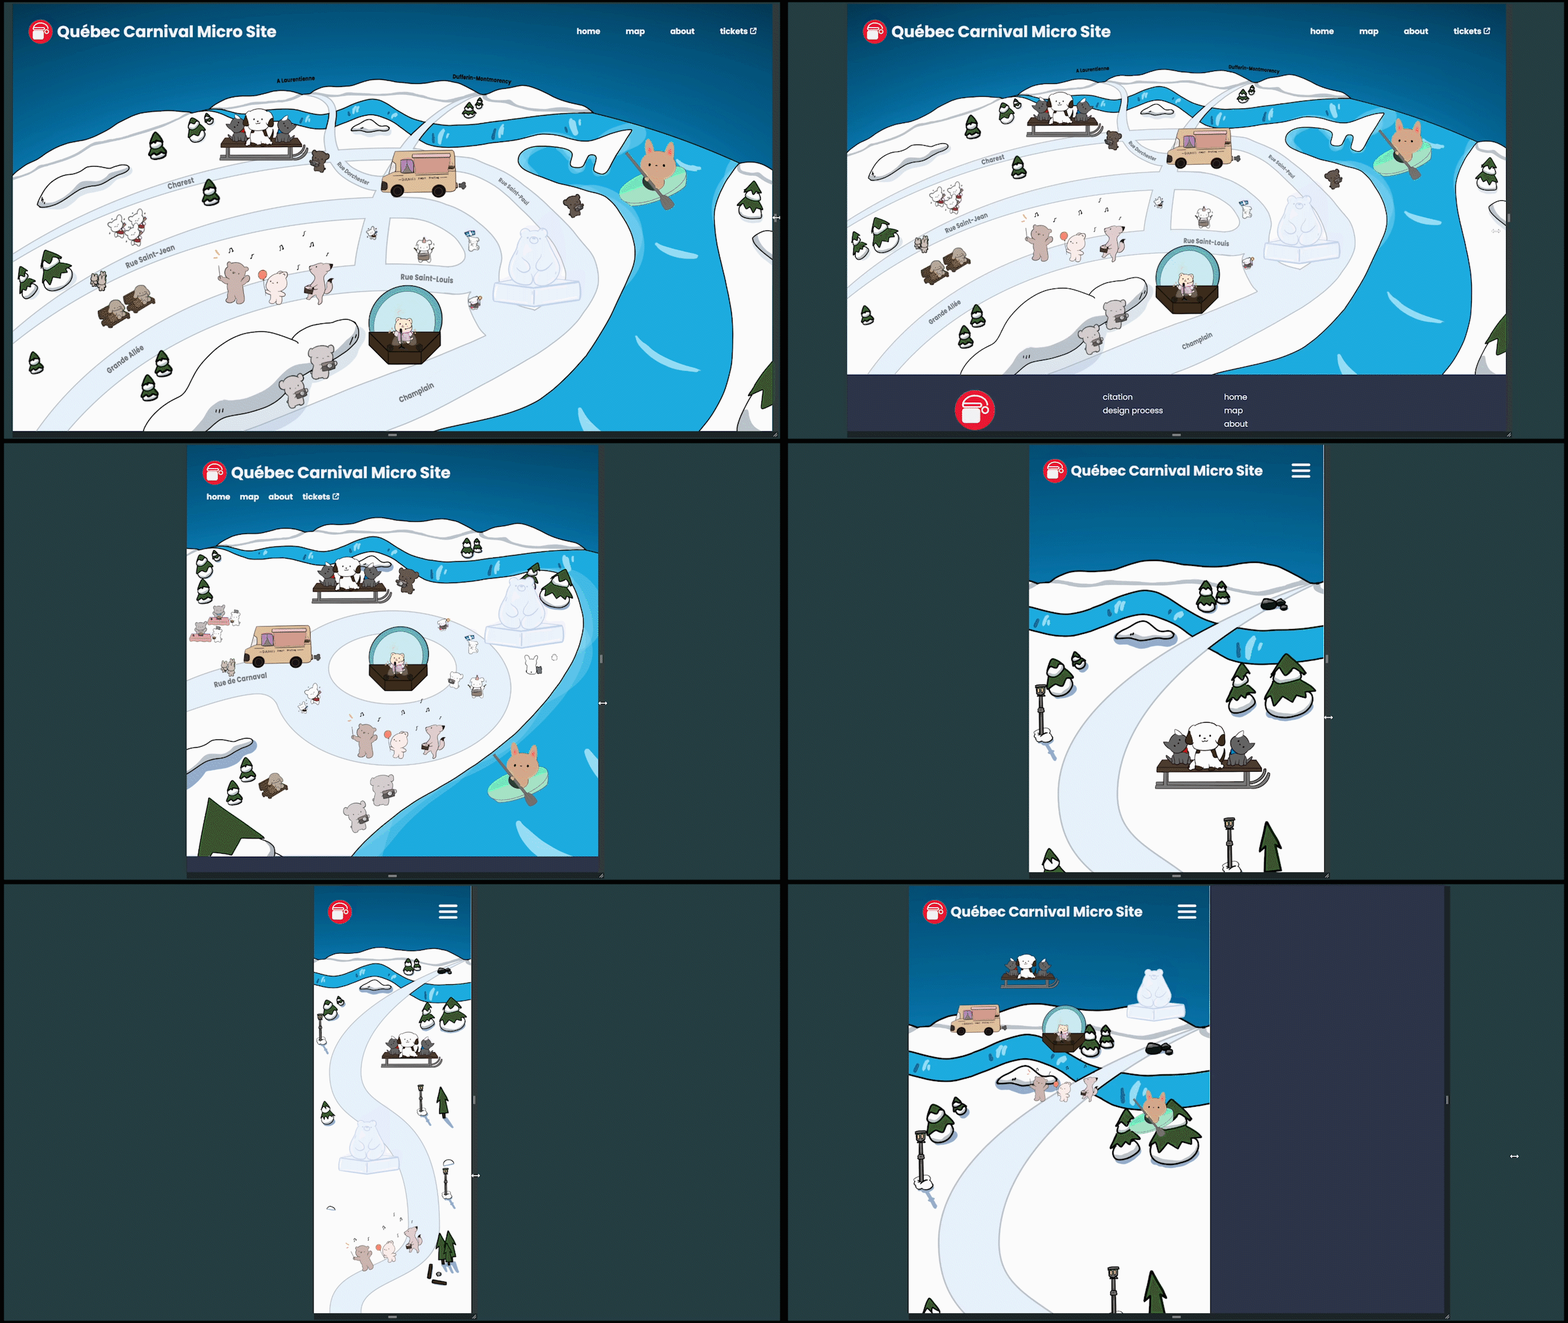
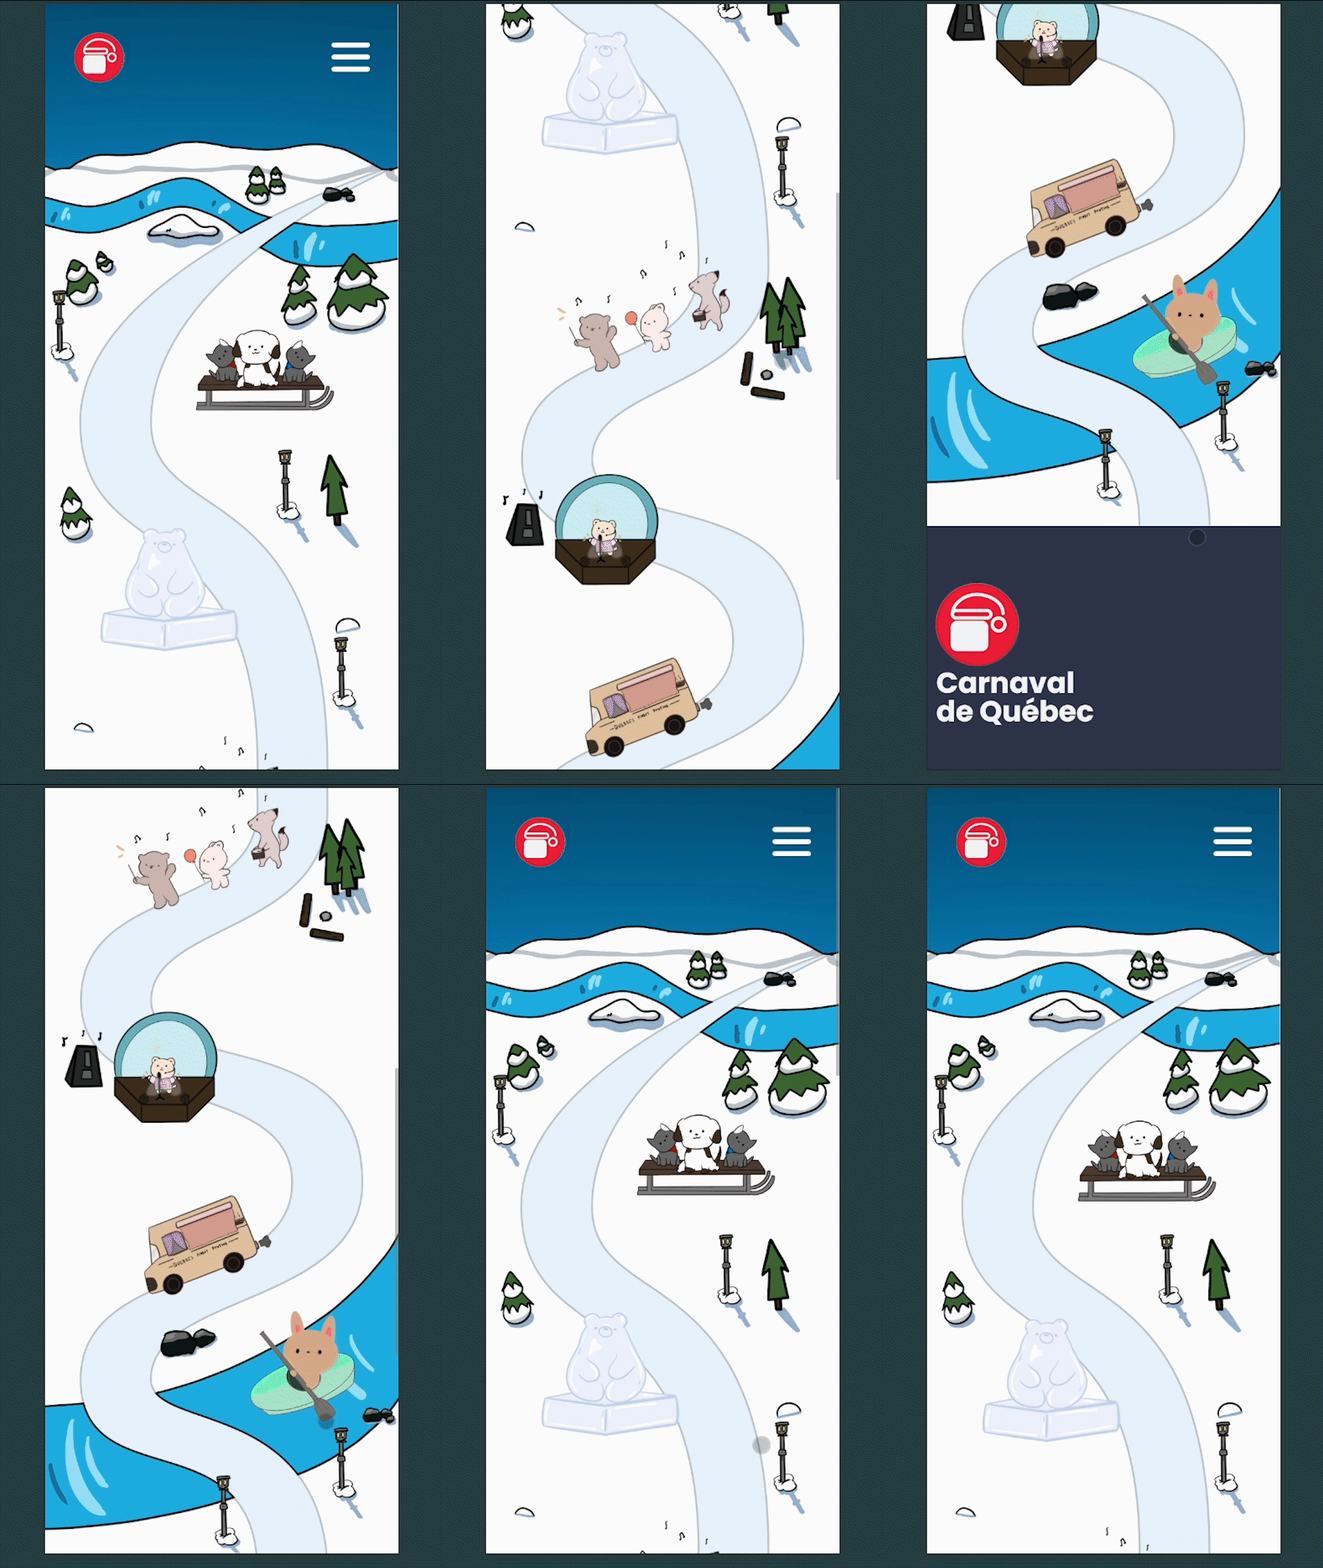
Québec Carnival Dynamic Map was a microsite based on Carnaval de Québec that provides a responsive interactive map inspired by Disney’s Club Penguin Map. This team project consisted of 5 members. As Lead Designer and Developer of the interactive map section, I sketched stylized map foundations, discussed creative additions with artists on the team, and developed the dynamic placement of information icons. Additionally, I focused on the responsiveness of the map and tailored the experience to fit the dimensions of the microsite. Québec Carnival Dynamic Map was created in 2023 for a 13-week class at Simon Fraser University.
Process
Ideation
During our team ideation meeting, we noticed the cluttered nature of Carnaval de Québec’s traditional map. Afterwards, I proposed the creation of a user-friendly interactive map as the microsite’s key feature. The decision to use a cartoon-style map heavily inspired by Club Penguin had the Carnival’s winter theme and all-age community in mind. First, I used Photoshop to sketch a low-fidelity mockup of the map to receive feedback from the team and class.

Prototyping
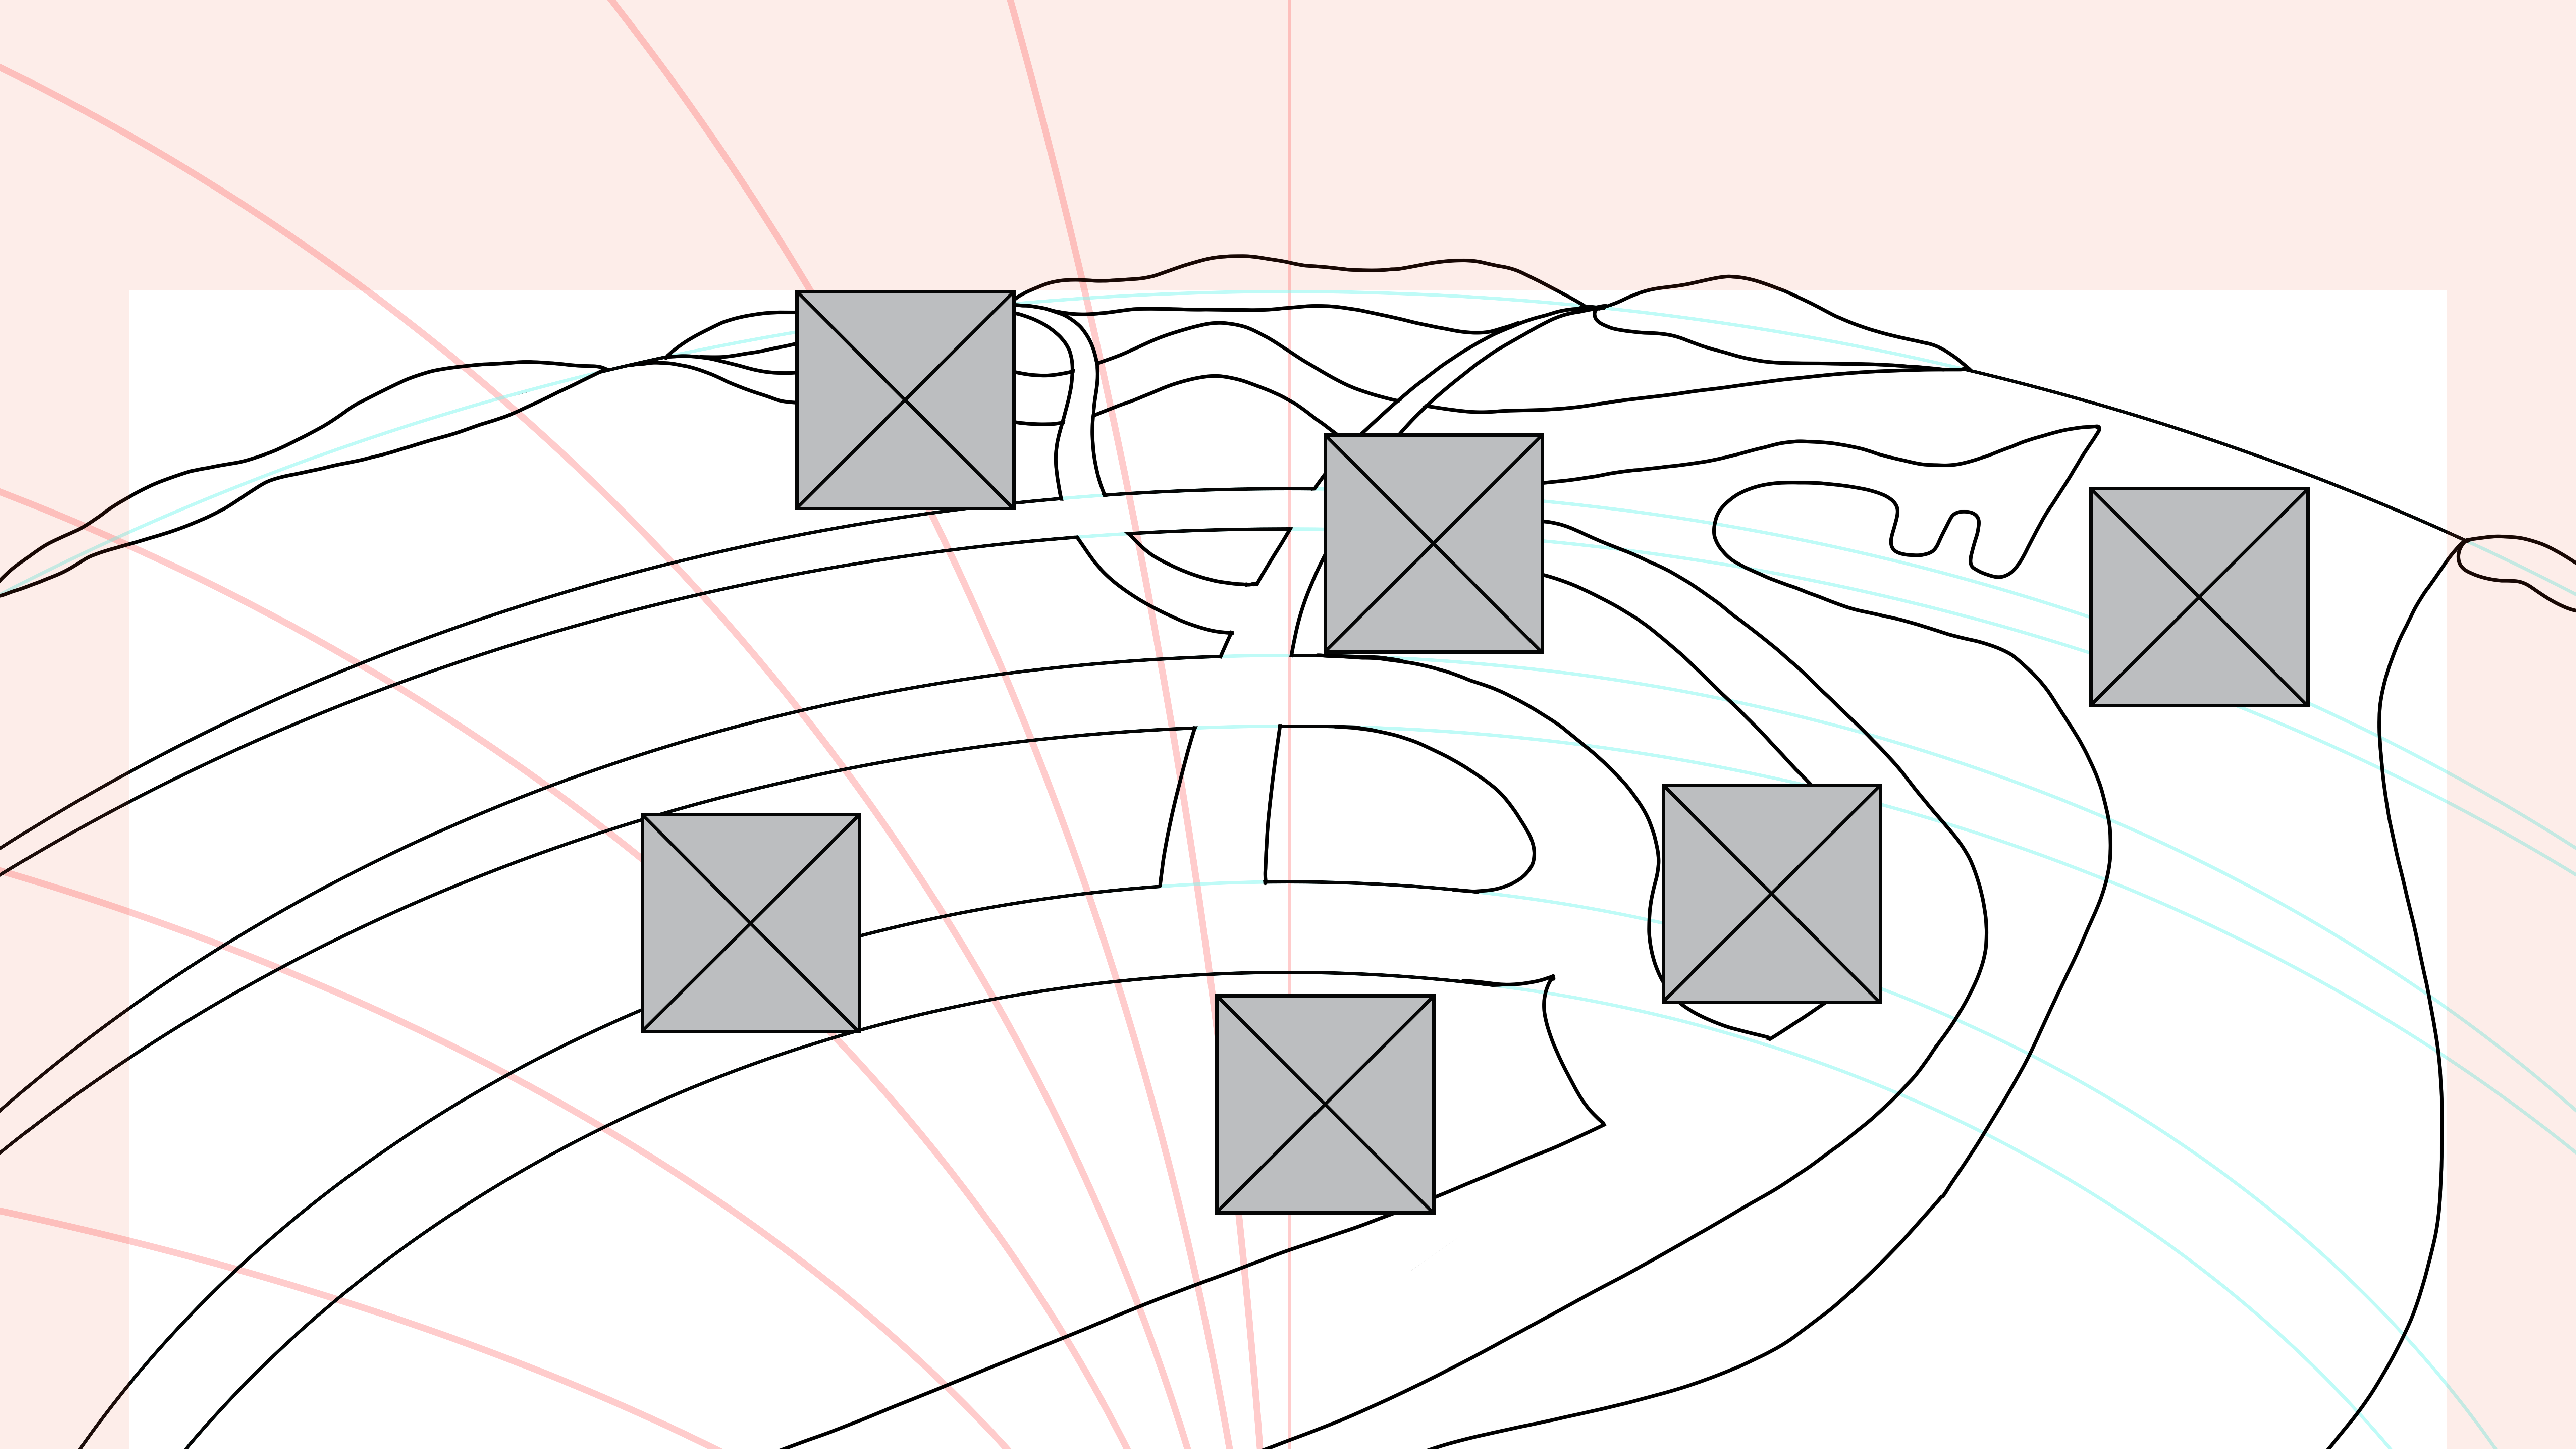
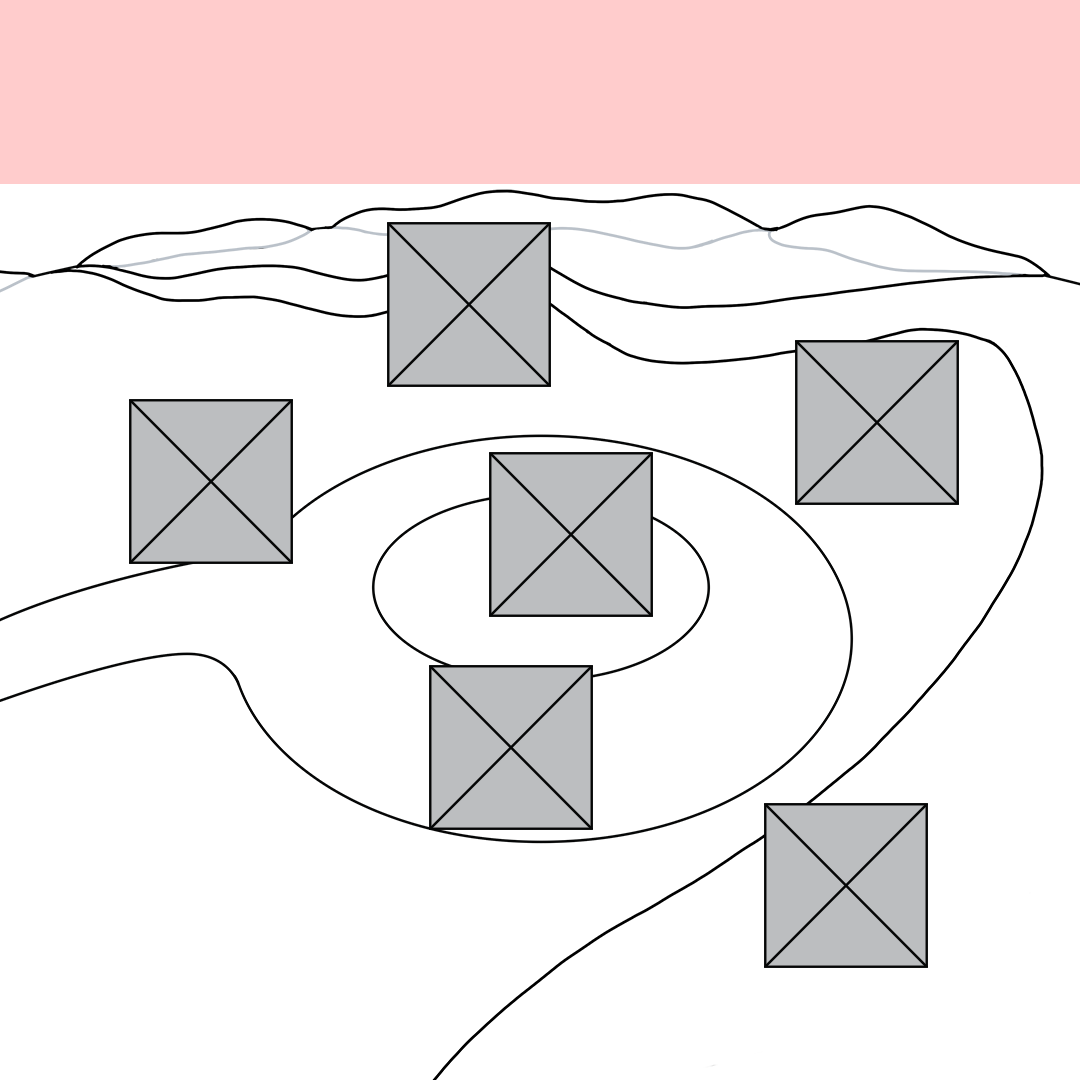
With adjustments based on the feedback, I moved into wireframing in Figma for smartphones, tablets, and desktops. The wireframes help guide the interactive icon placement while scripting the HTML and CSS.
An issue we Fixed
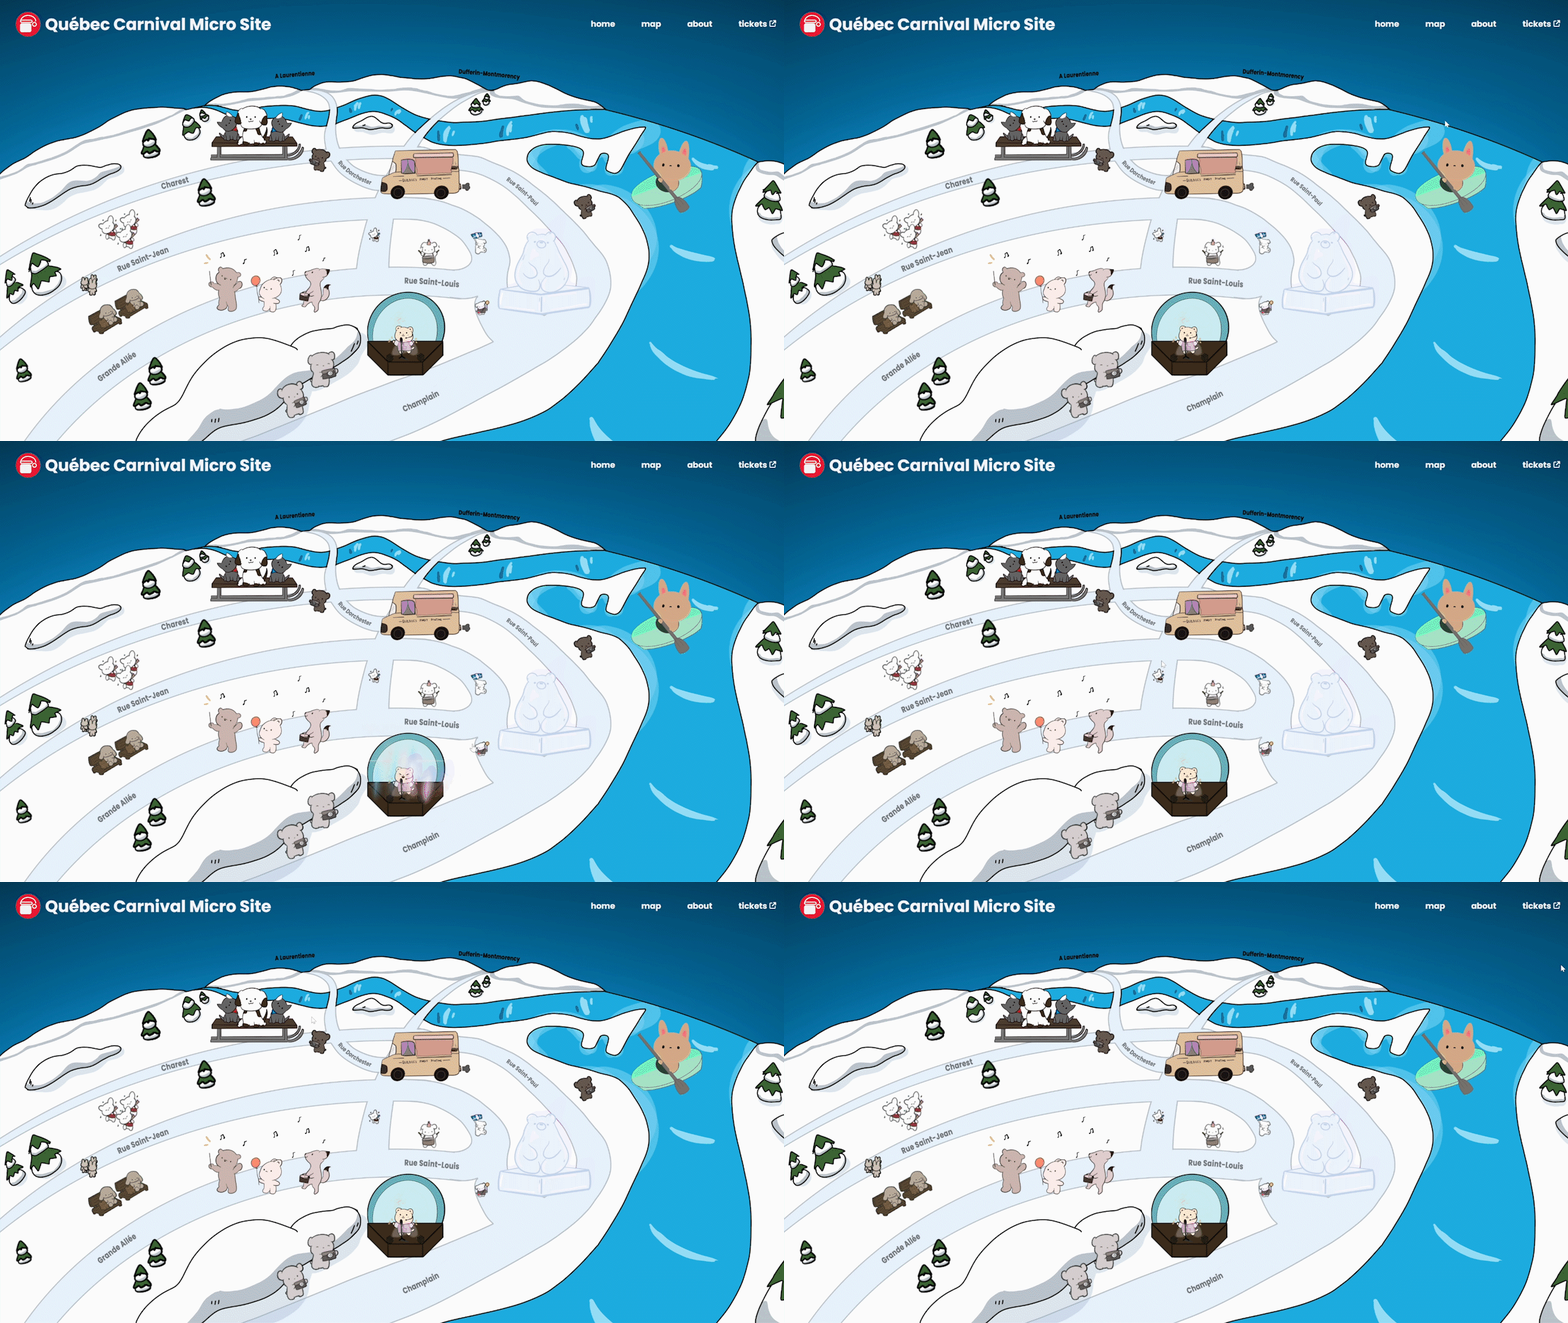
One user interface issue we found was the lack of affordable provided before hovering over icons. Users did not realize the elements were clickable. To solve this, we added a subtle looping bounce animation to the CSS which separated the icons from the background image.
Final Thoughts
The Québec Carnival Dynamic Map improve my skills in responsive web design and its incorporation into creative ideas to make functioning prototypes. I began by planning wireframes with different screen sizes to support responsive viewing of the map. Then, by collecting client and peer feedback, I iterated on the original design to improve clarity, and visual interest.